Não publicado

Introduction to Urban Data Science
Harish Doraiswamy - University of New York
Cities are thus the loci of resource consumption, of economic activity, and of innovation. Given our increasing ability to collect, transmit, store, and analyze data, there is a great opportunity to better understand cities, and enable them to deliver services efficiently and sustainably while keeping their citizens safe, healthy, prosperous, and well-informed. This course introduces approaches required for the analysis of cities through the use of urban data, in particular, spatial urban data. The course is broadly divided into two parts. The first part of the course, which also includes a lab component, will cover basic techniques from data management and visualization to help get started with spatial urban data sets. The second part of the course will cover example case studies showcasing advanced analysis techniques to help better understand urban data.

Visualization of Uncertain Spatial Data
Nivan Ferreira - Universidade Federal de Pernambuco
Considering uncertainty is key to effectively reasoning about visualized data and hence to the decision making process. However, creating effective visual representations of uncertainty is a difficult open research problem due to the fact that difficulties that people have interpreting uncertainty and also that reading these visualizations often translate to performing statistical inferences by eye. This is especially true in the case of spatial data visualization in which cases the design space is constrained by geographical information. Many research efforts (some very recent) proposed visualization designs to attack this problem, but to the best of our knowledge, no formal evaluation has been done to compare them. In this talk, we discuss the state-of-the-art in spatial data visualization and presentthe initial results of ongoing research that aim to compare these designs via a user study.
Generation of semantic layouts for interactive multidimensional data visualization
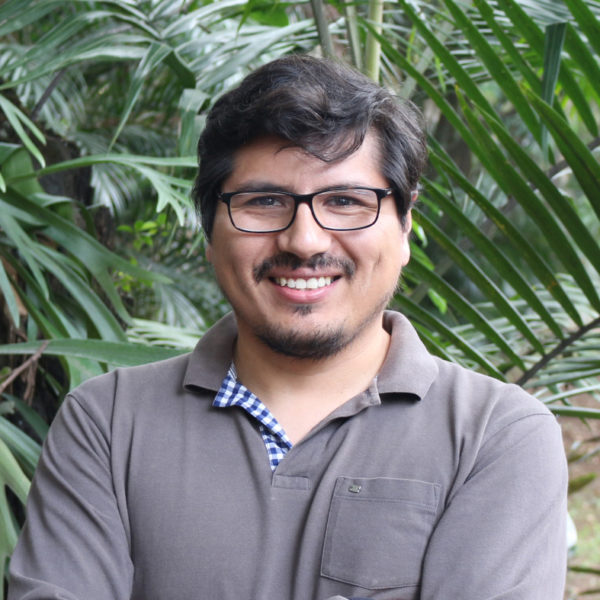
Erick Gomez - Center for the Study of Violence at University of Sao Paulo
Visualization methods make use of interactive graphical representations embedded in a display area in order to enable data exploration and analysis. These typically rely on geometric primitives for representing data or building more sophisticated representations to assist the visual analysis process. One of the most challenging tasks in this context is to determine an optimal layout of these primitives which turns out to be effective and informative. Existing algorithms for building layouts from geometric primitives are typically designed to cope with requirements such as orthogonal alignment, overlap removal, optimal area usage, hierarchical organization, dynamic update among others. However, most of such techniques are able to tackle just a few of those requirements simultaneously, impairing their use and flexibility. In this talk, we will review a set of approaches for building layouts from geometric primitives that concurrently addresses a wider range of requirements and their applications on text, image, and video analysis.

Topological Data Analysis, Basics and Computation
Siddharth Pritam - DataShape (Inria)
Topological Data Analysis (TDA) is a recent and fast growing field providing a set of new topological and geometric tools to infer relevant features for possibly complex data. This talk will be an introduction, to basic fundamental and computational aspects of TDA. In particular, I will present recent advances in computational technique using simplicial collapses.

Interactive Visual Analysis of Large Urban Data
Harish Doraiswamy - Center for Data Science and Visualization Imaging and Data Analysis Center, New York University.
The recent explosion in the number and size of spatio-temporal data sets from urban environments and social sensors creates new opportunities for data-driven approaches to understand and improve cities. Visualization and visual analytics systems have been successfully used at enabling users to obtain insight: well-designed visualizations substitute perception for cognition, freeing up limited cognitive/memory resources for higher-level problems. Supporting the interactive response times these systems require is challenging as they often rely on computationally expensive spatial and spatio-temporal queries involving polygonal constraints of arbitrary shapes and sizes. This problem is further compounded as data set sizes increase. In this talk I will first give an overview of Urbane, a multi-resolution visual analytics framework that enables a data-driven analysis of cities. I will then present techniques that use GPUs to obtain real time performance for spatial queries and are at least two orders of magnitude faster than existing database systems.

Visualisation of Digital Collections: State of the Art and Challenges
Asla Medeiros e Sá - Fundação Getulio Vargas
After decades of massive digitization initiatives, large collections if items have emerged inside institutions as well as on the web. The volume of information promises new modes of analysis and increased levels of access to the information. Going beyond the standard representations of search centric and grid-based interfaces, a multitude of approaches has recently started to enable visual access to digital collections, and to explore them as complex and comprehensive information spaces by the means of interactive visualizations. This class of information visualizations gives rise to a notable diversity of interaction and representation techniques in connection with visualization design. In this talk, I will review information visualization approaches to digital collections and reflect on the state of the art in techniques and design choices. I’ll then discuss three different types of digital collections datasets.

Visual Crime Analysis in Big Cities: A Practical Essay from Crime Data in São Paulo
Germain García Zanabria - Institute of Mathematics and Computer Science of the University of São Paulo
Big cities typically present a high volume of crimes ranging from petty thefts to homicides. Moreover, the type and pattern of crimes change considerably around the cities, usually presenting regions where crimes are more frequent and typically accompanied by gratuitous violence. São Paulo (the largest city in South America) bears high criminality rates with great variability in patterns of crimes, even in geographically close regions. These characteristics make glyph-based crime mapping completely unsuitable for analyzing crimes. So, in this context, arises the demand for visualization assisted analytical tools customized to support the analysis of criminal activities in urban areas with the characteristics of a city such as São Paulo. These analytical tools have to be able to compare and analyze crime rate variations, reveal crime patterns and hotspots (with different levels of details) while they still allow uncovering their temporal dynamics and relation with infrastructure and social factors.
Crime Patterns and Urban Infrastructure around Schools
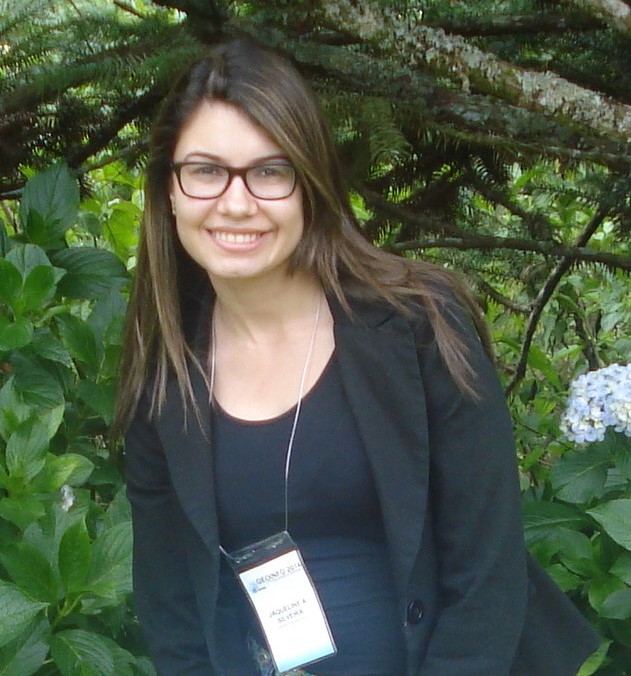
Jaqueline Alvarenga Silveira - Institute of Mathematics and Computer Science of the University of São Paulo
Understanding the relation between crime patterns and the characteristics of each region has long been a topic of research interest. In fact, several studies have accomplished to understand how socioeconomic variables (population, rent values, economic level, and unemployment rate) and urban infrastructure (presence of bars, banks, and schools) affect particular crime types. The study of criminal activities nearby schools has also been of great interest, mainly to assist public policy makers in their decisions. In this context arises the necessity to develop versatile analytical mechanisms to extract patterns from multiple data sources, enabling the clustering of schools according to those patterns. So, in our research, we want to provide answers to three main questions: i) which is the relations between crime events and the other variables involved in the analysis, ii) which are the variables that most influence students perception of crime, and iii) how to mathematically handle the multiple data sources to uncover patterns. During the presentation, I am going to show you some methodologies turn out to be quite effective to answer the questions above.

Lessons learned in developing a crime analytics solution
Emanuele Santos - Universidade Federal do Ceará
Computer-based technology has played a significant role in crime prevention over the past 30 years. The advances in information and communication technology, made possible by the rapid evolution of computer hardware and software, allowed the law enforcement agencies to develop and use innovative applications to face crime. However, frequently police departments have access to systems that are too complicated and excessively technical, leading to modest usage. To solve this problem, we worked closely together with domain experts from police agencies in Brazil and in the USA to develop a crime analytics solution that allows users without technical expertise to create and share analyses. In this talk, I will present our approach and share the lessons learned during its development and deployment.
Social physics of criminal interactions
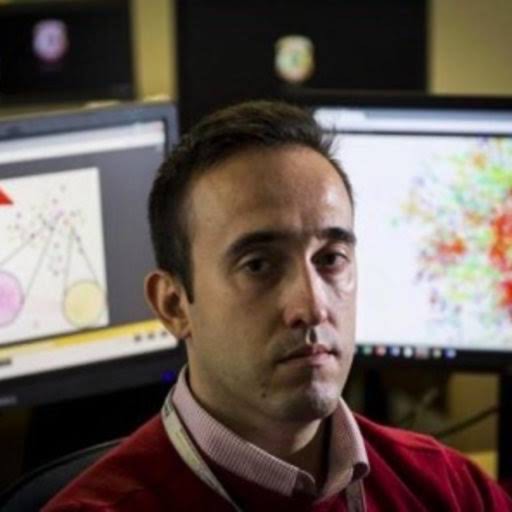
Bruno Requião da Cunha - Brazilian Federal Police
The idea of applying natural science methods to collective human behaviour, what is called social physics, started in the 1700s with names such as David Hume, and Adolphe Quetelet. The concept stayed dormant for a few centuries, but returned recently due to the development of sophisticated methods from network science, data science and modern physics. In this lecture I will briefly talk about the history of social physics and its applications to criminal phenomena. I will then show and discuss the most recent developments in the field and how it can be used to change our approach to criminal networks and effectively create bespoke strategies to fight crime.

Crime Analytics and Multiagent Crime Simulation: Concepts and Applications
Vasco Furtado - Research and Innovation at the University of Fortaleza
Understanding social phenomena such as crime requires tools capable of capturing, representing, and exploiting the various facets of a complex system. Data science and multi-agent systems are suitable for this purpose and are able to validate pre-established theories as new perspectives. Data Science provides a framework for exploring historical data to understand social phenomena. Multiagent systems allow to simulate the dynamics of the social phenomenon through the interaction of the actors involved. In this presentation, I will discuss these technologies and present my research over the past 20 years with examples of how crime analysis and public safety can be supported.

Studying similarity among brazilian legal documents
Jorge Poco - Fundação Getulio Vargas
Most Supreme Court (STF) cases are usually resolved through the use of precedents, that is, by examining cases where the same legal problem has previously been resolved by a court. Currently, the determination and analysis of a judicial precedent is done manually. This is why this research project aims to develop data science methodologies and tools based on automatic learning and natural language processing to analyze legal documents in Brazil that will allow us to validate the correct use of court precedents, and to automatically understand and predict some existing standards in these documents, which will allow us to identify and suggest new judicial precedents.

Legal data science: the case of the Supreme Court in Numbers project
Ivar Hartmann - Fundação Getulio Vargas
In the last 8 years the research project "Supreme Court in Numbers" has coupled legal and computational academic expertise with a keen eye for the institutional challenges of the Brazilian Supreme Court in order to meet civil society's demand for basic information and sophisticated explanations of the complex apex court, using a database of over 2 million cases created and enriched by a multidisciplinary research team at the FGV Law School in Rio de Janeiro.

Interactive Visual Analysis of Large Urban Data
Harish Doraiswamy - University of New York
The recent explosion in the number and size of spatio-temporal data sets from urban environments and social sensors creates new opportunities for data-driven approaches to understand and improve cities. Visualization and visual analytics systems have been successfully used at enabling users to obtain insight: well-designed visualizations substitute perception for cognition, freeing up limited cognitive/memory resources for higher-level problems. Supporting the interactive response times these systems require is challenging as they often rely on computationally expensive spatial and spatio-temporal queries involving polygonal constraints of arbitrary shapes and sizes. This problem is further compounded as data set sizes increase. In this talk I will first give an overview of Urbane, a multi-resolution visual analytics framework that enables a data-driven analysis of cities. I will then present techniques that use GPUs to obtain real time performance for spatial queries and are at least two orders of magnitude faster than existing database systems.
Disordered urban development, water crises and the justice system
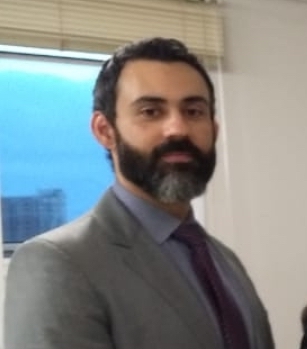
Guilherme Chavez Nascimiento - Ministério Público do Estado de São Paulo.
I) Some figures on water in Brazil and the world. II) Brief considerations on clandestine allotments in the context of watershed planning, management and management. III) What are we doing and what do we need to do?

